
Consolidated management reporting
An intuitive, reliable, and fast management reporting platform. Make the right decisions with up-to-date financial and operational data.
BrightAnalytics: an AI powered platform
At BrightAnalytics, we believe AI should empower finance teams to work smarter, faster and more intuitively. By embedding AI into our platform, we unlock efficiency, accuracy and insight, enabling CFOs and controllers to focus on strategy over routine.






- Financial reporting
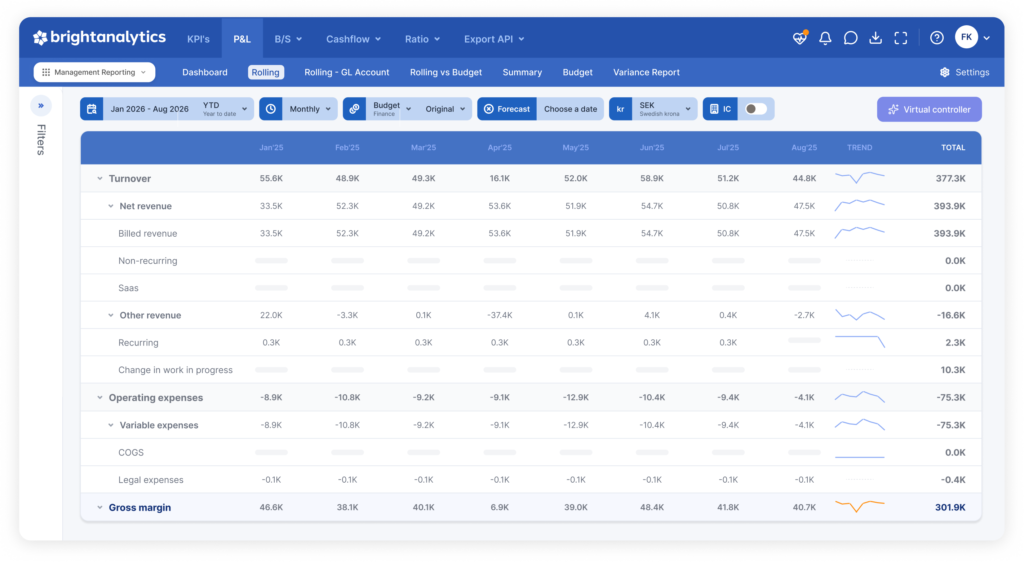
Get your P&L, balance sheet, and cash flow straight from your source systems, with mapping and currency logic applied automatically.
- Report straight from the source
Your P&L, balance sheet, and cash flow stay current, with AI-suggested mapping and drill-down to every entry. Add multi-currency, CTA calculation, extra reporting structures, and custom reports as you need them.

- P&L, balance sheet, and cash flow
- GL mapping, data enrichment and drill-down
- Flux analysis and insights
Consolidated Financial ReportingSee your P&L, balance sheet, and cash flow instantly, and switch between dashboards and deep-dive analysis.
 Let AI handle the mapping
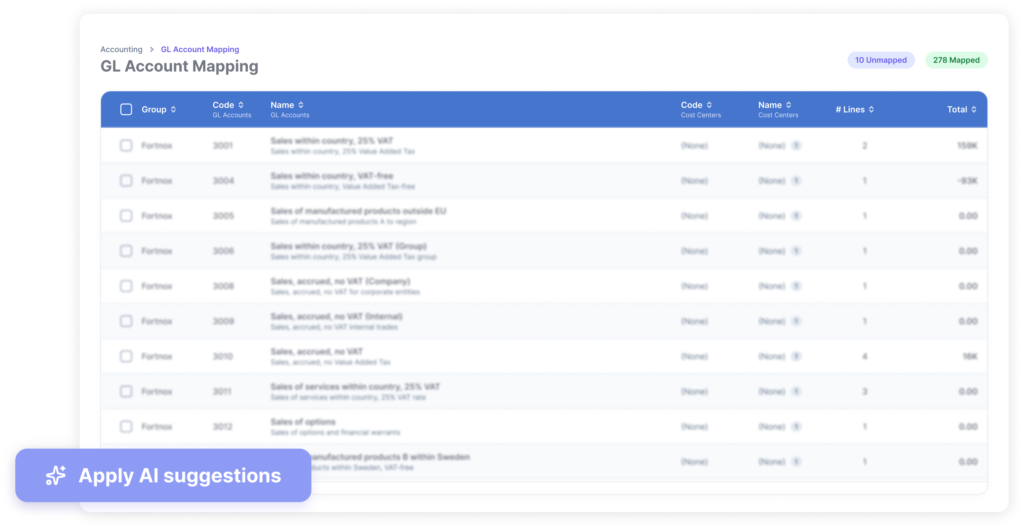
AI suggests how your GL accounts map to your financial statements, so you approve instead of building it by hand. Account names are translated and standardized automatically, so reports stay consistent across every country and entity.

- Consolidation
Bring every entity into one consolidated view, with AI-driven intercompany matching and automated consolidation entries.
- From separate entities to one consolidated view
Intercompany transactions are matched and eliminated, and consolidation entries are applied across every entity. Add proforma consolidation when you need to model results alongside your legal and management consolidation.

- Intercompany matching and elimination
- Basic consolidation entries
- Manual enrichments
Advanced ConsolidationTrack acquisitions, share issuances, and dispositions in the shareholder register, with goodwill and minority interests calculated automatically.
 Intercompany
Let AI find and match intercompany transactions across entities, see where balances don’t agree, and eliminate them once you confirm.

- FP&A
Budget, forecast, and model scenarios on the same live data as your actuals, with AI flagging variances along the way.
- Plan, forecast, and control, all in one platform
Build budgets and rolling forecasts alongside your actuals and plan around the drivers that move your business.

- Budgeting and rolling forecast
- Budget vs. actuals comparison
- Driver-based planning
- Virtual controller
Controlling AccountsAnalyze revenue and costs by customer and supplier, with a P&L that drills straight down to your key relationships.
 Controlling Dimensions
Analyze revenue, costs, and margins by project, department, or product group, and compare actuals against budget for each.
 Cash Forecasting
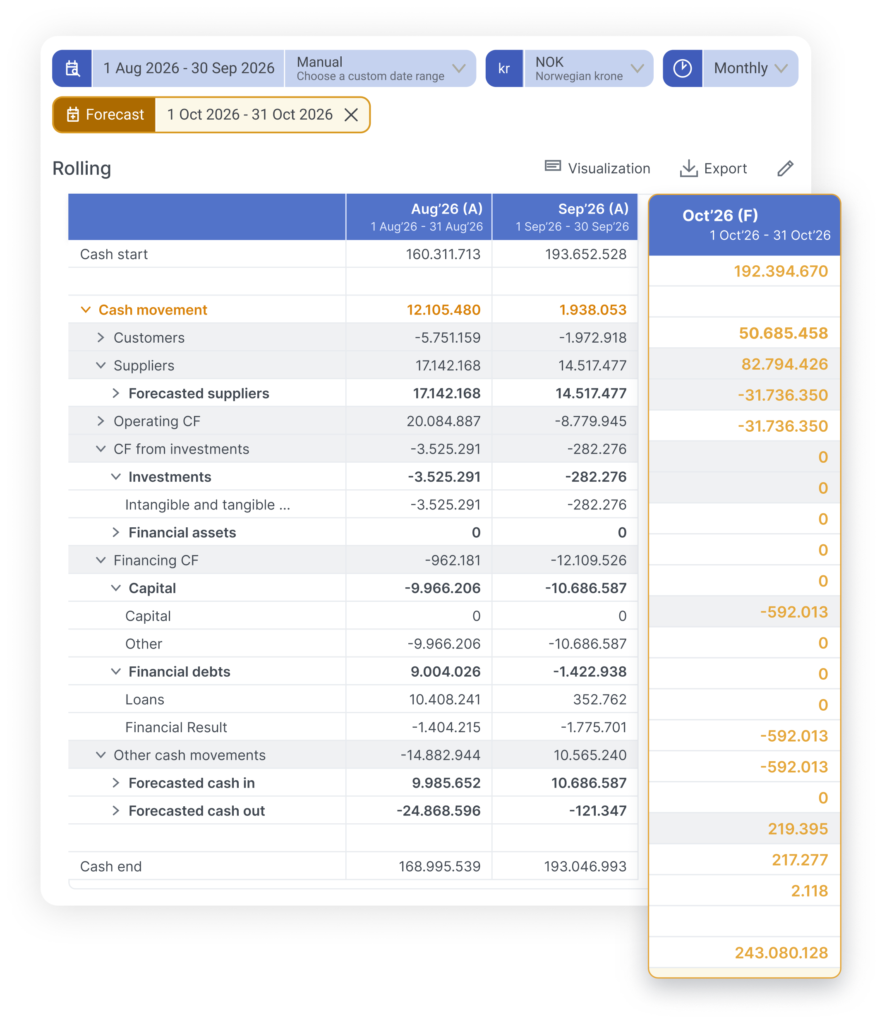
Predict your future cash position from historical figures, budgets, aging data, and repayment tables, and see shortfalls coming while there’s still time to act.
 Customers & Suppliers (aging)
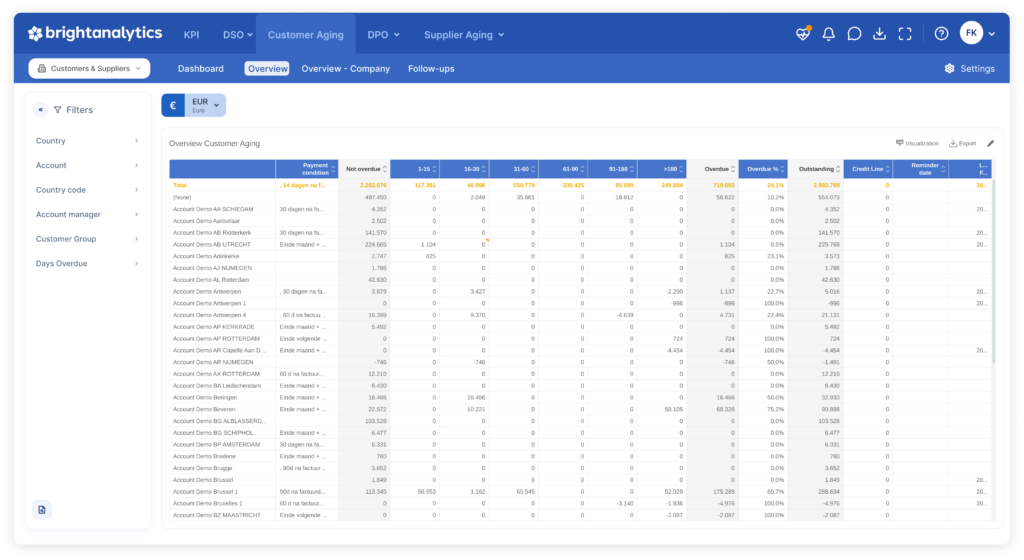
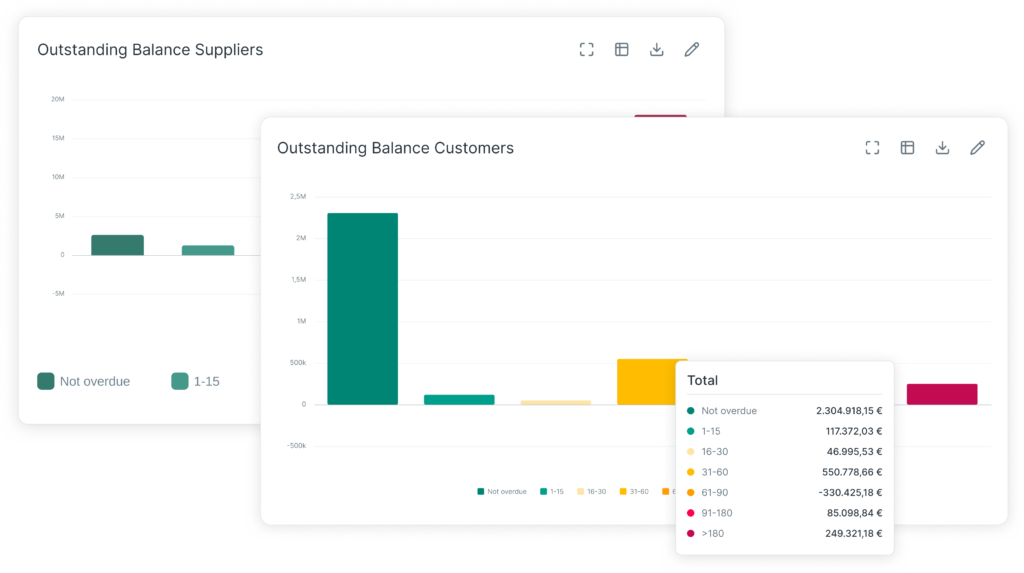
Follow up on open invoices and track payment behavior with Days Sales Outstanding (DSO) and Days Payable Outstanding (DPO).

- Financial closing
Run your close on validated data, with nightly health checks, balanced sub-ledgers, and locked periods in one workspace.
- Close with confidence, not a checklist of manual tasks
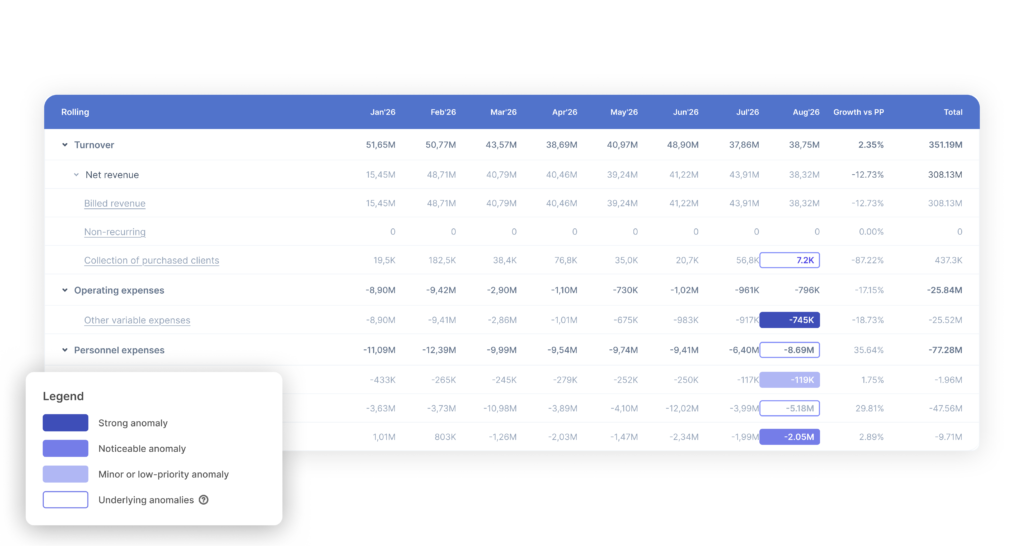
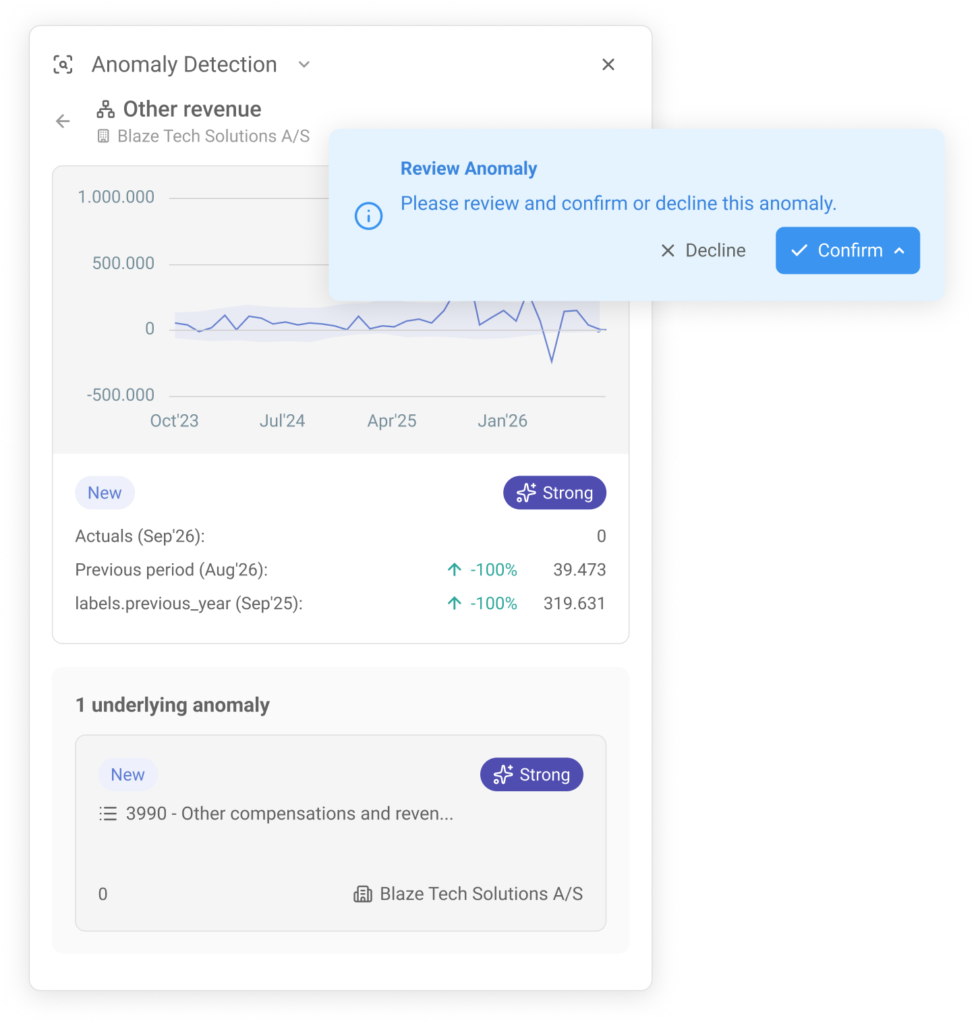
Your data is checked every night and every change is logged, so your close is validated and auditable by default. Add advanced AI flux analysis and Virtual Controller to have unusual movements flagged with their likely cause.

- Nightly health checks and data validation
- Audit logs and user logs
- Data load monitoring
Intercompany reconciliationLet BrightAnalytics find and match intercompany transactions across entities, see where balances don’t agree, and eliminate them once you confirm.
Let AI do the checkingFlux Agents compare your numbers against previous periods and budget and trace unusual deviations to the transactions behind them. Virtual Controller flags irregularities as they appear, and both get sharper with every suggestion you approve.

- Operations
Connect sales, HR, project, and ESG data to the same foundation as your financials for a daily view of performance.
- See how your business is really running, not just the numbers behind it
Operational data sits right next to your financials, so you see what’s driving the numbers every day.

- Operations
- HR analytics and staffing
- Billability
- SaaS metrics
- KPIs and data warehouse
Pipeline & DealsFollow every deal from open to closed, with deal value by stage, closing rates, and time to close.
 SaaS Metrics
Track ARR, MRR, churn, and net retention straight from your subscription data.
 Billability
Track billable, non-billable, and leave hours in real time, by project, team member, or client.
 HR Analytics
See headcount, hours, payroll, and sickness rates in one view, and spot pressure points before they affect delivery.
 ESG Start
Cover your mandatory ESG KPIs, track employee and fleet data, and set targets you can follow over time.

Your P&L, balance sheet, and cash flow stay current, with AI-suggested mapping and drill-down to every entry. Add multi-currency, CTA calculation, extra reporting structures, and custom reports as you need them.
- P&L, balance sheet, and cash flow
- GL mapping, data enrichment and drill-down
- Flux analysis and insights
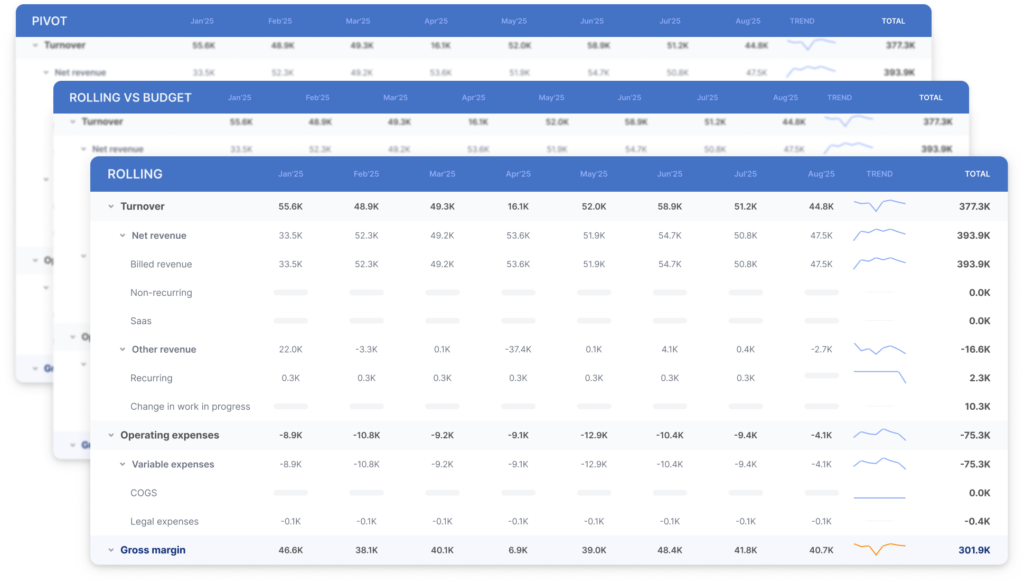
See your P&L, balance sheet, and cash flow instantly, and switch between dashboards and deep-dive analysis.
AI suggests how your GL accounts map to your financial statements, so you approve instead of building it by hand. Account names are translated and standardized automatically, so reports stay consistent across every country and entity.
Intercompany transactions are matched and eliminated, and consolidation entries are applied across every entity. Add proforma consolidation when you need to model results alongside your legal and management consolidation.
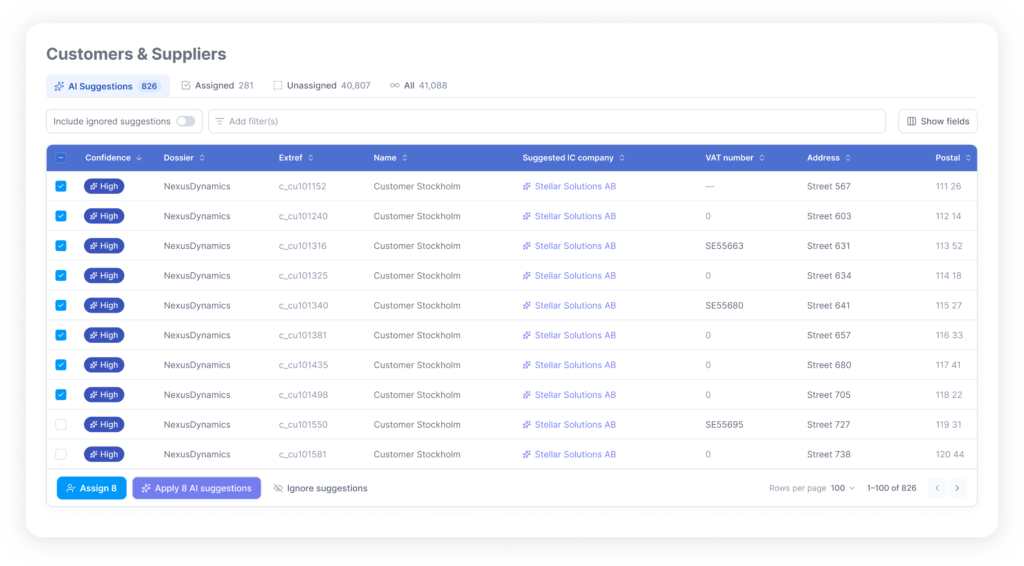
- Intercompany matching and elimination
- Basic consolidation entries
- Manual enrichments
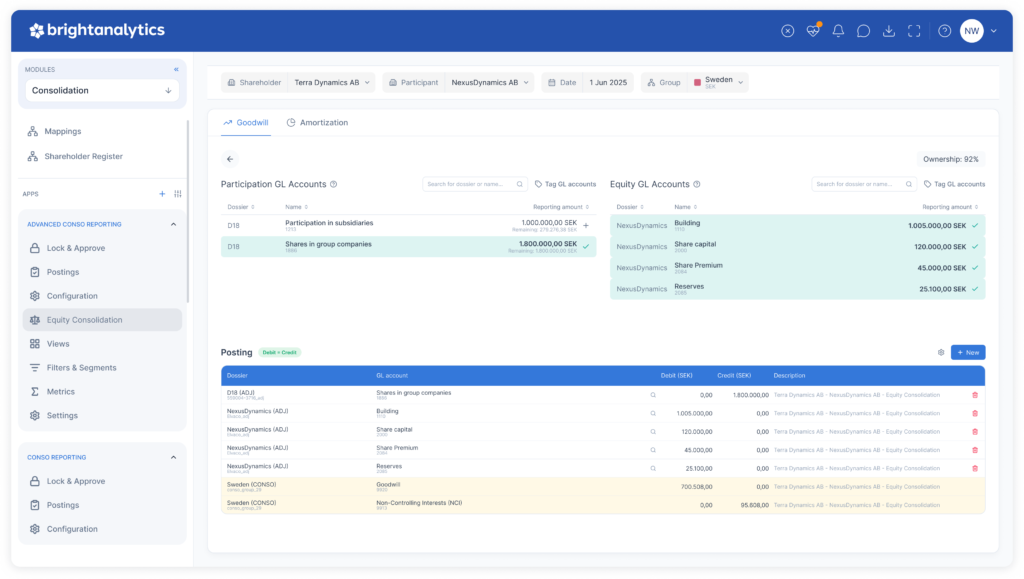
Track acquisitions, share issuances, and dispositions in the shareholder register, with goodwill and minority interests calculated automatically.
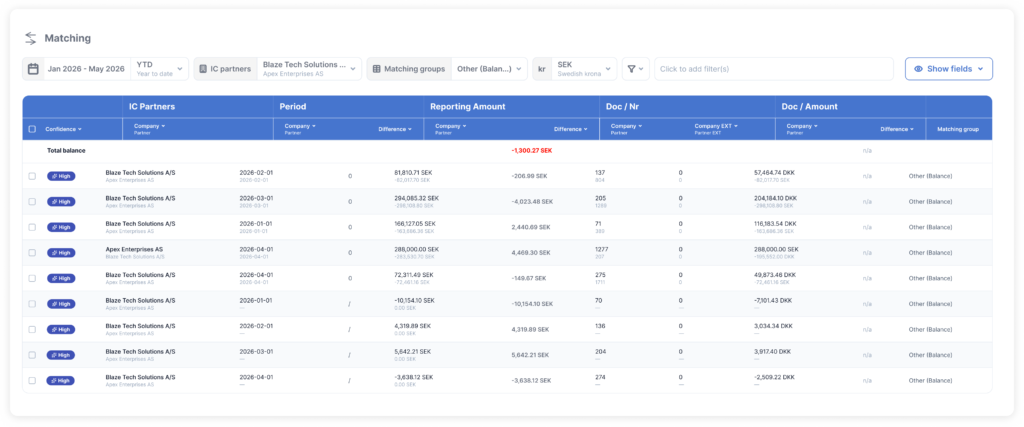
Let AI find and match intercompany transactions across entities, see where balances don’t agree, and eliminate them once you confirm.
Build budgets and rolling forecasts alongside your actuals and plan around the drivers that move your business.
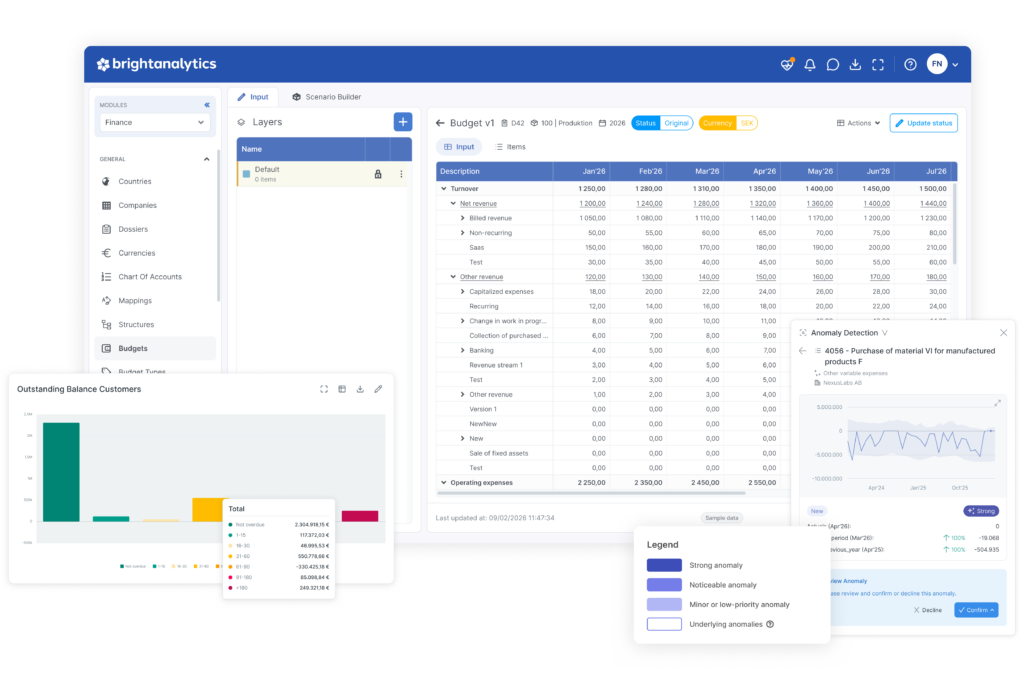
- Budgeting and rolling forecast
- Budget vs. actuals comparison
- Driver-based planning
- Virtual controller
Analyze revenue and costs by customer and supplier, with a P&L that drills straight down to your key relationships.
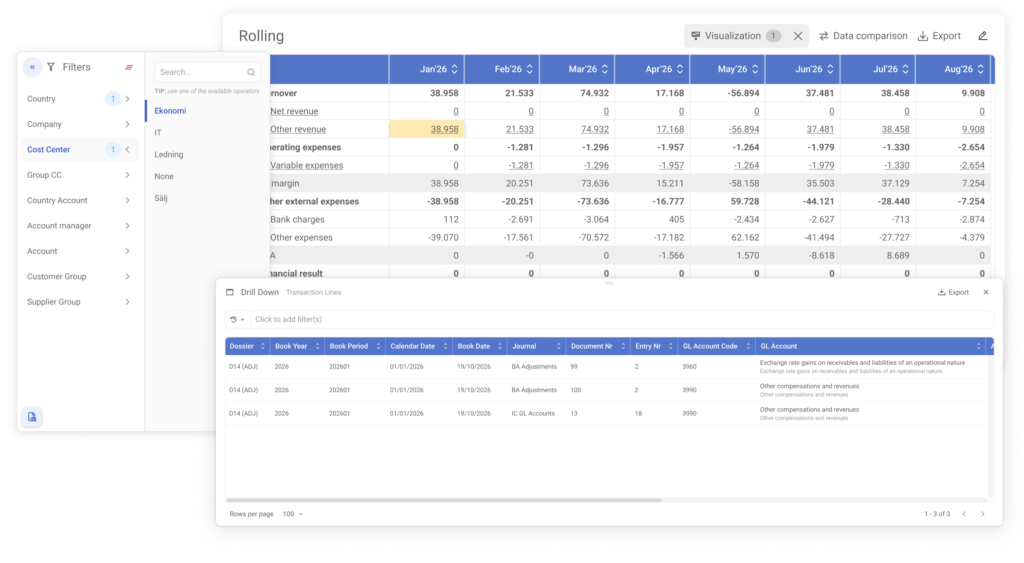
Analyze revenue, costs, and margins by project, department, or product group, and compare actuals against budget for each.
Predict your future cash position from historical figures, budgets, aging data, and repayment tables, and see shortfalls coming while there’s still time to act.
Follow up on open invoices and track payment behavior with Days Sales Outstanding (DSO) and Days Payable Outstanding (DPO).
Your data is checked every night and every change is logged, so your close is validated and auditable by default. Add advanced AI flux analysis and Virtual Controller to have unusual movements flagged with their likely cause.
- Nightly health checks and data validation
- Audit logs and user logs
- Data load monitoring
Let BrightAnalytics find and match intercompany transactions across entities, see where balances don’t agree, and eliminate them once you confirm.
Flux Agents compare your numbers against previous periods and budget and trace unusual deviations to the transactions behind them. Virtual Controller flags irregularities as they appear, and both get sharper with every suggestion you approve.
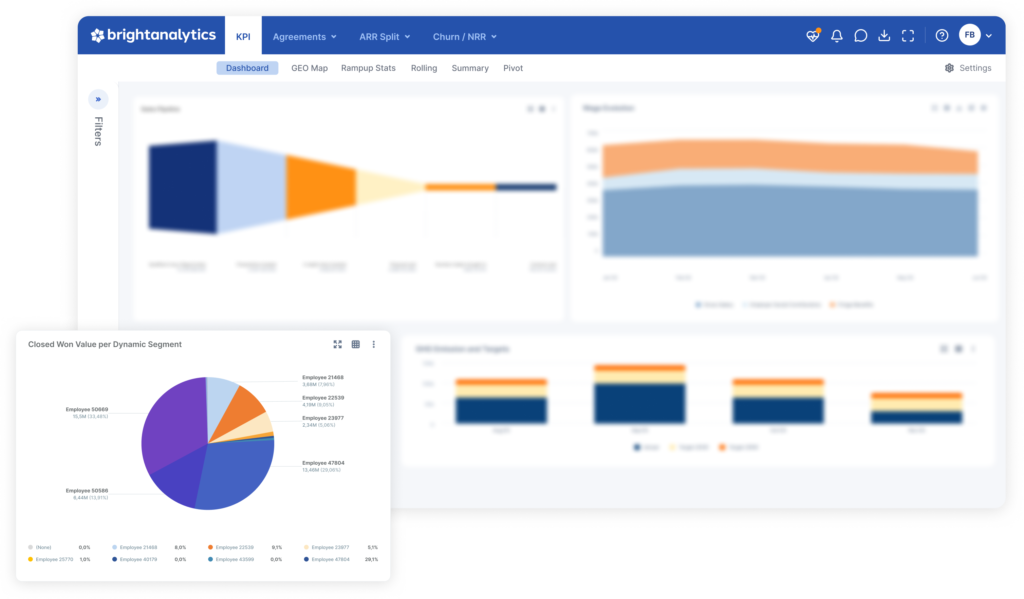
Operational data sits right next to your financials, so you see what’s driving the numbers every day.
- Operations
- HR analytics and staffing
- Billability
- SaaS metrics
- KPIs and data warehouse
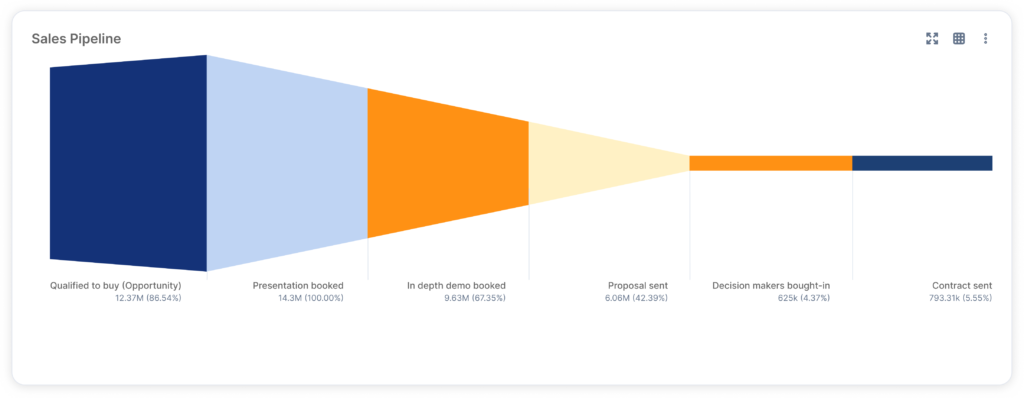
Follow every deal from open to closed, with deal value by stage, closing rates, and time to close.
Track ARR, MRR, churn, and net retention straight from your subscription data.
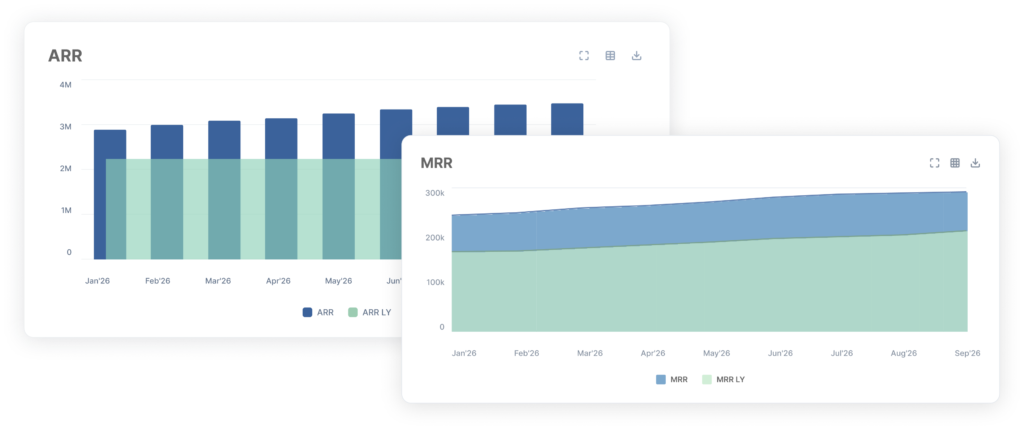
Track billable, non-billable, and leave hours in real time, by project, team member, or client.
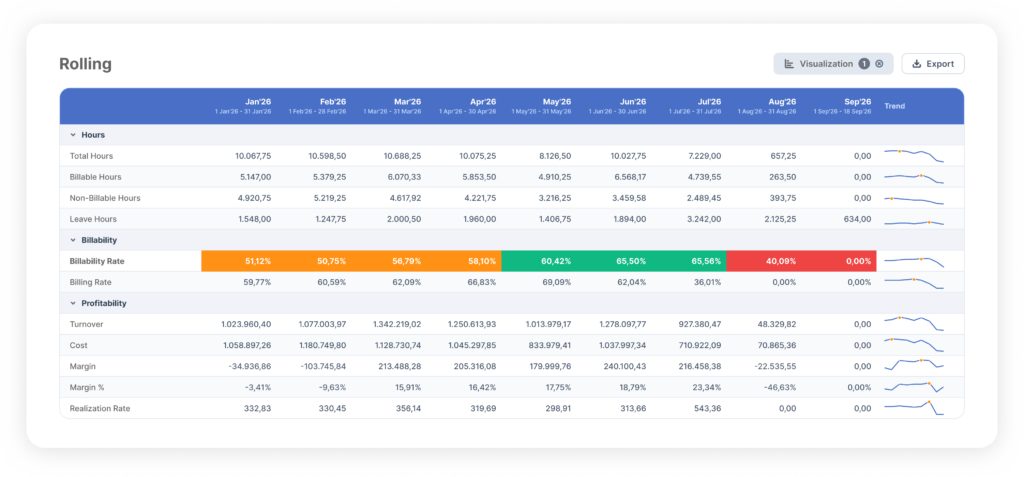
See headcount, hours, payroll, and sickness rates in one view, and spot pressure points before they affect delivery.
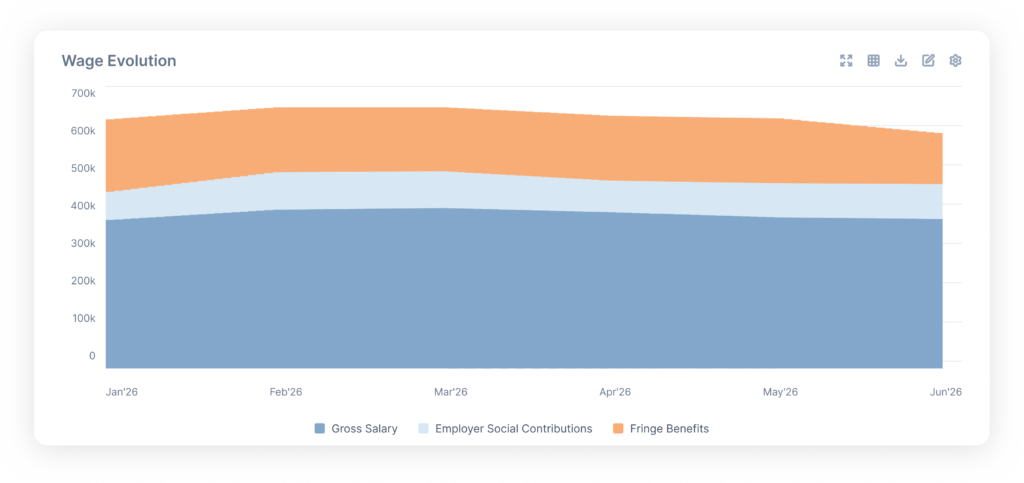
Cover your mandatory ESG KPIs, track employee and fleet data, and set targets you can follow over time.
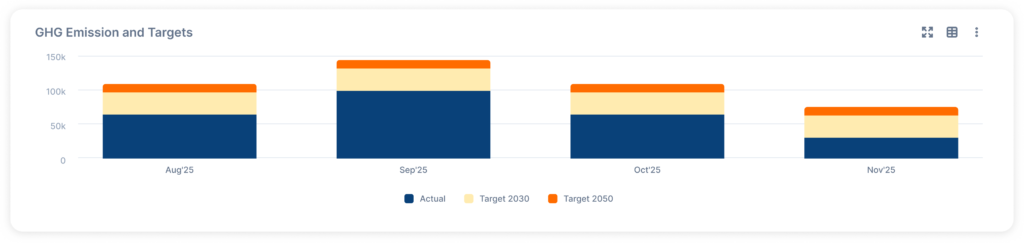











- What is management reporting?
Management reporting is collecting data and visualizing it in a simple way.
- What is financial reporting?
Financial reports provide insight into how the company is doing, in this case more specifically its financial status.
- What is operational reporting?
Operational reports provide insight into your company’s operational KPIs, such as consultant profitability, time performance, sales, product lifecycle…
- Who is BrightAnalytics?
BrightAnalytics is a growing technology company. Our goal is to help companies streamline their management reporting processes.